Documentation
1. Introduction
CORAZON (Correlation Analyses Zipper Online) is a tool for normalize databases and clustering genes through gene expression values in tissues, with a focus on biological processes, molecular functions and evolution studies. This tool was implemented using unsupervised machine learning adopting Euclidean distance a measure of similarity. Machine learning is a subfield of computer science that developed from the study of pattern recognition and computational learning theories in artificial intelligence. These methods operate through the construction of a model based on the set of inputs, in order to make data predictions. Due to the large quantity of biological data generated in large-scale genomics and transcriptomics projects, an intense demand to use techniques provided by artificial intelligence, the usage of tools based on machine learning methods became widely used in bioinformatics. Unsupervised learning is the machine learning task of inferring a function to describe the hidden structure from unlabeled data. These methods transform the genes expressions on coordinates of a point in space and cluster by their similarities. The inductor analyzes the examples provided and tries to determine if some of them can be grouped in any way, forming clusters. This online tool calling CORAZON includes 3 unsupervised machine learning algorithms: Mean Shift, K-Means and Hierarchical with the bioinformatics purpose. Reference: Ramos, T.A.R., Maracaja-Coutinho, V., Ortega, J.M., do Rêgo, T.G. CORAZON : a web server for data normalization and unsupervised clustering based on expression profiles . BMC Research Notes 13, 338 (2020).
2. Registration
Submission in CORAZON can be made as guest user, without registration. When you don’t create an user or only wants to normalize the database, you should take note of your process identifier number (ID) that will be displayed at the pop-up window. This is the number that the guest user and the normalization user utilize at the Results tab to check the process status and the result of the submission. Please, be aware that only valid IDs that were submitted as a guest user can be checked of this way, and anybody can recover the results from a job that was submitted as a guest user. When verifying the ID on the search area, five responses can show up: 1) Invalid ID, if the value do not belong to a previously guest-submitted job, ou if the ID doesn’t exist; 2) Error in you datafile, if the submitted data file doesn’t in a correct format; 3) Queued, if the job was successfully submitted, but hasn’t started being processed yet; 4) Running, if the job is currently being processed by CORAZON and 5) Download, when the job has finished running. Click at Download link to open or download the results.
Registration in CORAZON can be quickly performed on the Sign Up tab, by simply fill in the form and submitting. When the user logged in at the Login tab, you’ll have access to your job tables in Results tab, which will display all your previously submitted job, with information concerning their parameters of choice, their normalizations files (if the option was marked), and their conclusion status. When submitting a new job, some parameters must be filled in.
3. Machine Learning Algorithms
Mean Shift
Mean Shift is a non-parametric clustering algorithm that doesn't requires the prior definition of the number of clusters and neither restrict the shape of the clusters. However it's necessary to define the bandwidth parameter, which influences the number of clusters formed and influence in the algorithm convergence speed. Small values tend to generate many clusters, while very large values tend to join multiple clusters into a single large cluster, therefore, the bandwidth definition is essential for the algorithm functioning.
The basis of mean shift is the density estimation. For each data point, also referred to as feature vector, the algorithm executes a gradient ascend on local estimated density until its convergence. The stationary points represent density modes. The mean shift vector always points in the direction of the maximum increase of density. The algorithm procedure performed for a given data point is described in the following points: 1. Calculates the mean shift vector; 2. Move the density estimation window; 3. Repeat the above steps until convergence, i.e, when the difference between the new and the old density estimation is smaller than a threshold.
For clustering, the procedure described above must be applied in all points of the set. Points that have the same stationary points are assigned to the same cluster.
K-Means
The K-Means method is executed based on the input parameter K (number of clusters) and partitions the set of input elements into K groups, also called clusters. The algorithm works as follows: 1. Arbitrarily select K elements from the database as the initial centers of clusters; 2. Each object is assigned to a cluster associated with the nearest center, i.e., in the cluster to which the element is most similar, according to the average value of the elements in the group (centroid); 3. Update the means of the clusters, calculating a new centroid for each one; 4. Repeat step 2 (with the new centroids) and step 3 until there is no change in the centers; 5. Stop step 4 when there are no elements changes from one group to another.
Hierarchical
The hierarchical method involves the construction of a tree-like structure by means of a hierarchy. The method used was agglomerative that consists of a series of successive groupings of elements, where the elements are aggregated, i.e. each object starts representing a cluster; at each step, one group or element is connected to another, according to its similarity, reducing the number of groups; and in the last step a single group with all the elements is formed. There are a variety of agglomerative methods, which are characterized according to the criterion used to define the distances between groups, the linkages methods.
The single linkage uses the shortest distance, i.e., it locates the two separated objects that representing the greater similarity and places them in the first group; then the next closest distance (or greater similarity) is determined, and a third object is added to the group of the first two, or a new group is formed. The distance (similarity) between any two groups is the shortest distance (greatest similarity) of any point in a group to any point in the other, and this distance is calculated by means of the Euclidean distance. The union procedure of the elements with smaller distances continues until the number K of clusters is reached and all the objects are in some of the K clusters. The parameters of the hierarchical that can be changed were the Number of clusters and the Linkage method that will be used.
The linkages that we provide is: Single; Complete (the distance between two clusters is defined as the longest distance between two points in each cluster); Average (the distance between two clusters is defined as the average distance between each point in one cluster to every point in the other cluster); Ward.D (the clustering is done through the minimum variance, implemented the algorithm described in Murtagh (1985)); Ward.D2 (the distance between two clusters is the sum of squared deviations from points to centroids, implemented the Ward’s method, the algorithm described in Kaufman and Rousseeuw (1990) and Legendre and Legendre (2012)); Mcquitty (when two clusters are be joined, the distance of the new cluster to any other cluster is calculated as the average of the distances of the soon to be joined clusters to that other cluster. Here, distance depends on a combination of clusters instead of individual observations in the clusters); Median (the distance between two clusters is the median distance between an observation in one cluster and an observation in the other cluster. This is a different averaging technique, but uses the median instead of the mean, thus downweighting the effect of outliers); and Centroid (When two clusters are combined into a new cluster, the new centroid is computed over all the original objects in clusters. The distance then becomes the Euclidean distance between the centroid of the new cluster and the centroid of a remaining cluster in the forest).
4. Submitting jobs and Parameters Explanation
To submit the jobs, firstly the user select the algorithm and the normalizations and parameters can filled in:
Normalizations
a. Transform to a TMM data file: TMM is the abbreviation of Trimmed Mean of M-values and the calculation is based on Robinson and Oshlack, 2010 (PMID: 20196867) method.
b. Transform to a MRN data file: MRN is the abbreviation of Median Ratio Normalization and the calculation is based on Anders and Huber, 2010 (PMID: 20979621) method.
c. Transform to a FPKM data file: FPKM is the abbreviation of Fragments Per Kilobase Million, and the calculation is based on the number of reads, gene size and the regions (tissues). This normalization is mathematically shown in Equation 1:
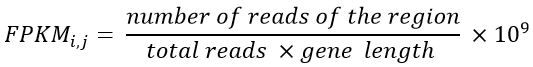
Equation 1- FPKM formula. Where number of read of the region is the number of reads of a tissue and total reads is the sum of all reads of this region (tissue).
d. Transform to a TPM data file: TPM is the abbreviation of Transcripts per Million. With the FPKM calculated, the calculation of the TPM becomes simpler, and this normalization can be calculated according to Equation 2.
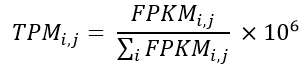
Equation 2- TPM formula.
e. Transform to a CPM data file: CPM is the abbreviation of Counts Per Million. The CPM calculation is based on the number of reads and regions (tissues) and its mathematical calculation is shown in Equation 3.
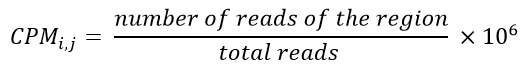
Equation 3- CPM Formula. Where number of reads of the region is the number of reads of a tissue and total reads is the sum of all reads of this region (tissue).
f. Compute log2 data file: This normalization extracts the log2 for each gene expression value and is mathematically shown in Equation 4.
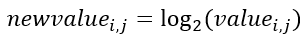
Equation 4- Normalization by log2.
g. Normalize data file by the sum of the instance's values: Here, the genes will be normalized by their expression values, the aim is to limit the values between 0 and 1. The normalization is calculated according to Equation 5.
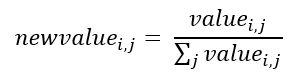
Equation 5 - Normalization by the sum of the attributes vector.
h. Normalize by the highest value of the instance: This, utilize the same principle of the previously, limit the values between 0 and 1, but here, instead of adding instance values, only divide the value with the highest value of the instance and the value is in percentage. Therefore, the calculation of this normalization is visualized in Equation 6.
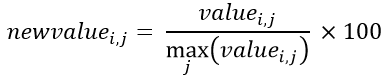
Equation 6- Normalization by the highest value attribute of each instance.
Parameters
a. Combination of all attribute-1: An option to observe the attributes influence in results. This strategy cluster the data removing each attribute per round in clustering process, to see the influence. b. Cluster All: The Mean Shift algorithm has the option to force all instances to belong to a cluster, if True; if False, a instance can belong to no cluster, i.e., the instance may not be clustered. c. Use discretized version of points: If true, initial kernel locations are not locations of all points, but rather the location of the discretized version of points, where points are binned onto a grid whose roughness corresponds to the bandwidth. Setting this option to True will speed up the algorithm because fewer seeds will be initialized. d. Bandwidth: The user can use the default strategy to select the size of bandwidth, or set the value. e. Number of clusters: The K-Means and Hierarchical algorithms have to specify the number of clusters that the data can be clustered. f. Max Iteration: Maximum number of K-Means algorithm iterations for a single run. g. Linkage: Is the criteria function in Hierarchical clustering to cluster the instances.
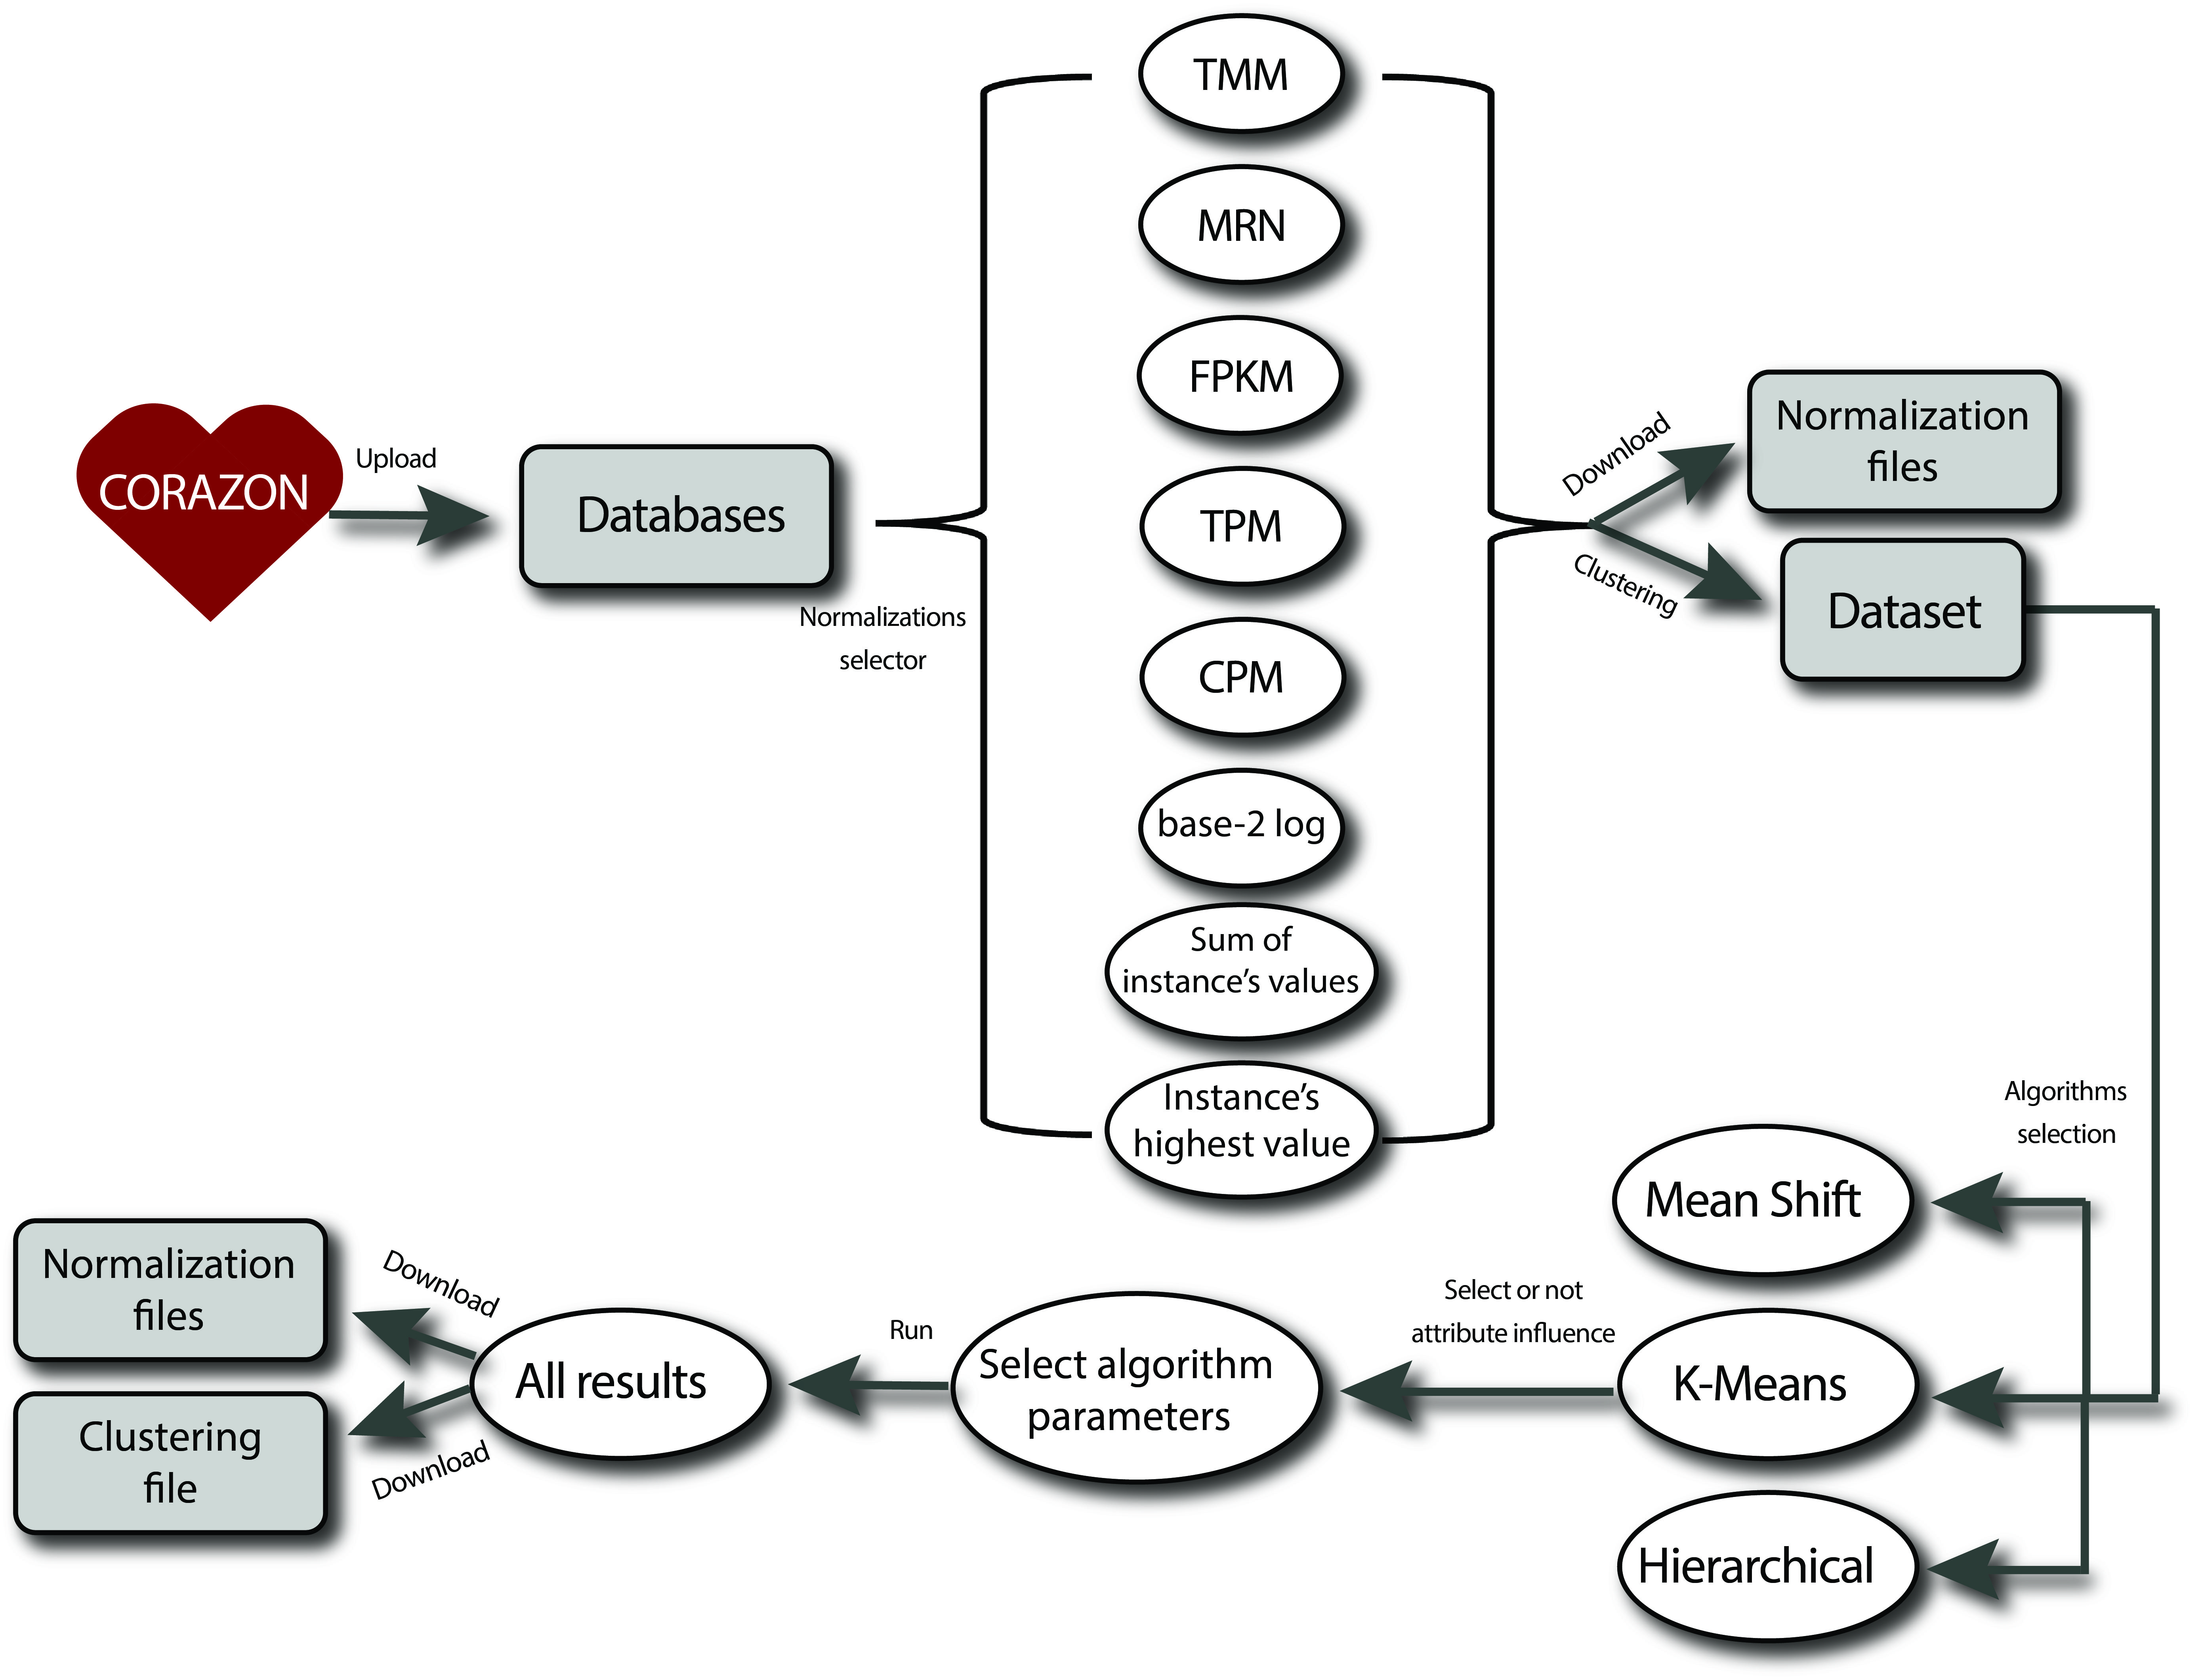
5. Input file example and CORAZON pipeline
CORAZON pipeline